Crush Margin Dynamics in the Soy Value Chain
In the soy value chain, the crush margin is a pivotal indicator of profitability, reflecting the difference between the revenue from soyoil and soymeal sales and the cost of soybeans. This margin is influenced by various factors:
Soybean Processing and Recovery Rates:
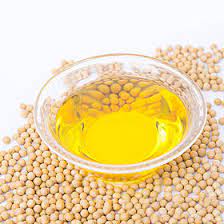
– Soybeans undergo crushing and solvent extraction, yielding soyoil at an 18% recovery rate alongside soymeal. Approximately 85% of soybeans are crushed globally.
Global Production and Trade:
Annual soybean and soyoil production ranges from 170-185 and 25-31 million tons respectively, constituting a significant portion of global oilseed and oil production.
Major producers include the US, Brazil, Argentina, China, and India, with crop arrivals varying between regions.
Global trade amounts to 55-60 million tons of beans, 8-10 million tons of oil, and 42-45 million tons of meal annually.
Key exporters of beans include the USA, Brazil, and Argentina, while major importers are China and the EU.
Argentina and Brazil dominate oil exports, while China and India are prominent importers.
Stakeholders in the Soy Value Chain:
– Major stakeholders encompass crushers, refined oil manufacturers, animal feed manufacturers, and farmers, contributing to the intricate dynamics of the soy value chain.
Influence of Market Factors:
-Major Refined Soybean Markets: Chicago (CBOT) serves as the largest soy futures market, while China’s Dalian Commodity Exchange trades beans and meal. Physical prices are determined by Argentina and Brazil’s FOB.
Indian Scenario:
India’s soy production, heavily reliant on the monsoon, ranges from 5-7 million tons of beans, 1 million ton of oil, and 3-5 million tons of soymeal in a normal year. Imports supplement around 2.5 million tons of oil.
Major Trading Centers:Indore, Ujjain, Dewas, Mandsore in Madhya Pradesh, Nagpur in Maharashtra, and Kota in Rajasthan are significant trading hubs in India.
Market Influencing Factors: Weather, area planted, international price movements, pests and diseases, competitive oils’ supply-demand dynamics, and demand for soymeal from the feed sector collectively shape market dynamics.
India in the Global Soy Industry
INDIA IN WORLD SOY INDUSTRY
| (Rounded figs.) | India | World | % Share |
|---|---|---|---|
| (In million tons) | |||
| Annual Seed Production | 6 | 180 | 3 |
| Annual Oil Production | 1 | 30 | 3.3 |
| Annual Oil Imports | 1.5 | 9 | 16.7 |
| Annual Oil Consumption | 2.5 | 30 | 8.3 |
| Annual Meal Production | 3.5 | 130 | 3.5 |
| Annual Meal Exports | 2.5 | 43 | 5.8 |
| Annual Meal Consumption | 1 | 130 | 0.7 |
DAILY PRICE VOLATILITY OF REFINED SOYOIL IN INDIA
| Daily Volatility in %< | < 1 | 1 – 3 | > 3 |
| % Occurrence | 81.95 | 17.69 | 0.36 |







+ There are no comments
Add yours