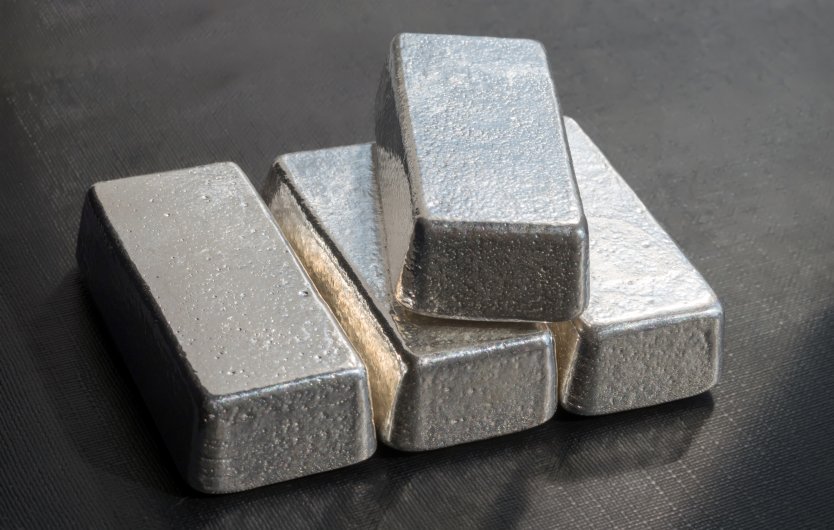
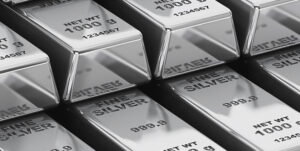
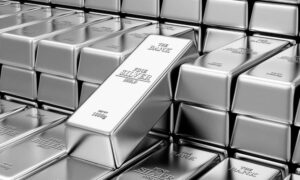
Silver possesses unique properties that render it invaluable in industrial applications, despite its classification as a precious metal. Its demand rests on three main pillars: industrial uses, photography, and jewelry & silverware, accounting for 342, 205, and 259 million ounces respectively in 2002. Just over half of the mined silver originates from Mexico, Peru, and the United States, making them the first, second, and fourth largest producing countries, respectively, with Australia being the third largest. Primary mines contribute approximately 27 percent of the world’s silver, while the remaining 73 percent is a by-product of gold, copper, lead, and zinc mining.
WORLD SILVER SUPPLY FROM ABOVE-GROUND STOCKS
| in Million Ounces | 2001 | 2002 |
|---|---|---|
| Implied Net Disinvestment | -9.5 | 20.9 |
| Producer Hedging | 18.9 | -24.8 |
| Net Government Sales | 87.2 | 71.3 |
| Sub-total Bullion | 96.6 | 67.4 |
| Scrap | 182.7 | 184.9 |
| Total | 279.3 | 252.3 |
The price of silver is not solely determined by its primary output but is influenced by the prices of other metals as well, given that world mine production is interconnected with the prices of other metals. The correlation between silver and economic activity is robust, with around two-thirds of total silver fabrication occurring in the industrial and photographic sectors. Imbalances between demand and supply often lead to declines in stocks held by governments and investors.
INDIA INDUSTRIAL FABRICATION, 2002
| in Percentage | |
| Pharmacy & Chemicals | 22.4 |
| Foil | 9 |
| Plating | 13.7 |
| Solders & Brazing | 5.4 |
| Electrical | 13.5 |
| Photography | 0.85 |
| Jari | 17.1 |
In the Indian scenario, silver imports for domestic consumption in 2002 totaled 3,400 tons, a decrease of 25% from the record high of 4,540 tons in 2001. Open General License (OGL) imports serve as the primary source of supply for the Indian market. Non-duty paid silver for the export sector witnessed a substantial increase in 2002, rising nearly 200% year-on-year to 150 tons. Approximately 50% of India’s silver requirements were fulfilled through imports, with significant sources including China, the UK, CIS countries, Australia, and Dubai.
Industrial demand in India stood at 1375 tons in 2002, marking a 13% decline from 1,579 tons in 2001. Despite this decrease, India remains one of the largest users of silver globally, alongside industrial giants like Japan and the United States. Unlike the US and Japan, where industrial demand primarily focuses on hardcore applications such as electronics and brazing alloys, only 15% of Indian industrial offtake is for such purposes, with the remainder being utilized for foils in decorative applications, jewelry plating, and jari.
In India, silver price volatility significantly influences demand, similar to gold. Notable price movements occurred between February 4th and 6th, 1998, with daily prices soaring by 22.3%, attributed to a prominent US financier accumulating nearly 130 ounces of physical silver. Since September 1999, daily silver prices have not experienced fluctuations exceeding 5% and weekly prices have done so only once.
FREQUENCY DISTRIBUTION OF SILVER LONDON FIXING VOLATILITY FROM 1995 TILL DATE
| Percentage Change Daily | > 7% | 5-7% | 3-5% | < 3% |
|---|---|---|---|---|
| Number of times | 7 | 10 | 85 | 2086 |
| Percentage times | 0.3 | 0.5 | 3.9 | 95.3 |
| Weekly | ||||
| Number of times | 9 | 15 | 50 | 363 |
| Percentage times | 21 | 3.4 | 11.4 | 83.1 |








+ There are no comments
Add yours